Implied & realized volatility got obliterated last week… As many noted already, VVIX down to lowest values since 2015. With a wave of rate cuts across central banks and persistent Fed dovish lean (even with rate cuts being priced out relative to start of year) + no terrible surprises after MAG7 earnings (still waiting for NVDA later on in May) markets are pretty much done with the vol building up from start of the year, now puking all of it in a span of a week…
It is perhaps premature to say that there’s nothing to do until late Aug/Sep now… and we ALWAYS get some sort of vol spikes here and there but overall it looks like the next major catalyst is set to come with election worries in Sep/Oct.
So, lets break down how this week went, look at various option structure performances, and go over the updated numbers for the systems discussed in previous posts:
Realized Volatility Overview
Overnight performance continues to dominate YTD for SPY, now up 8% relative to RTH up only <2%.
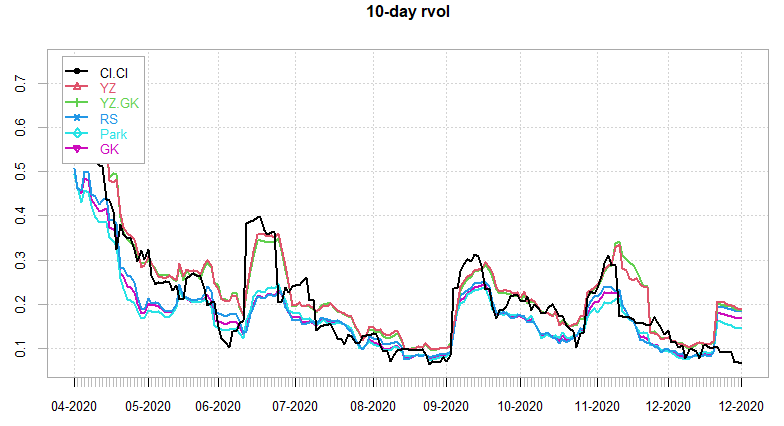
With the speed of rally last week (up almost 5% in a week) realized 10d & 21d vols are slow to catch down to implieds. 10-day implied vols barely trading above 10 for forward atm strikes. Some intraday vol measures breaking 10 already… which isn’t that surprising considering even during 2020 summer vols broke 10 realized to the downside:
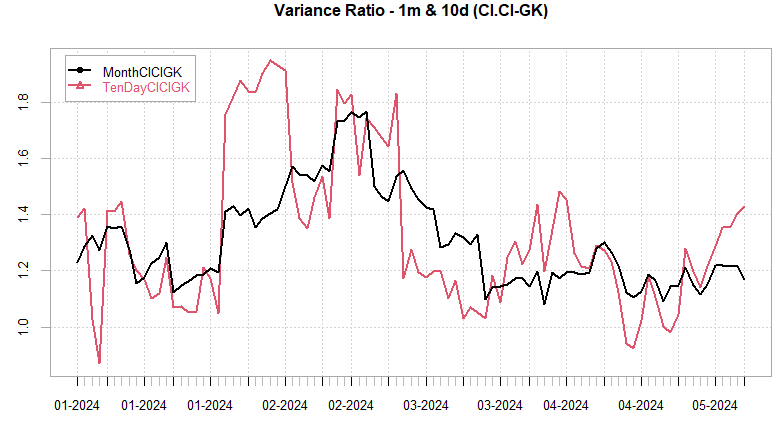
In terms of variance ratios, monthly vols haven’t really collapsed yet (we did move quite a bit and upside vol is still vol), however, the collapse in intraday vol weighing on the faster ratios:
SPX ATM Straddle Performance
Post FOMC rally was priced slightly cheap as the rally took us 4% higher in a couple of days, however, 4 days of red through rest of week (although still net up ~4pts for the week.)
RTH straddles down decent 40 pts on the week… gap and camp week…
Overnight straddles up ~21pts, a rare occurrence for sure!
Any intraday straddles pretty much down anywhere from 20-40pts on the week…
Variance Ratio Conditional Performance
From my previous posts on variance ratios and intraday / interday volatility:
Updated performance YTD:
Combines PnL from a long/short 1-DTE straddle portfolio & long/short 0-DTE straddle portfolio based on different variance ratios, details described in posts.
0-DTE Momentum / Mean Reversion
From the following post:
Attempted to recreate JPM intraday momentum index using 0-DTE’s, however, intraday momentum has essentially died now… at least last year and half… with mean reversion doing alot better this year:
… and momentum:
Details described in main post
VX Carry & SPX Overlay
From the following posts:
VIX Futures carry struggling so far this year… whipsaws & generally implied vols were picking up all year… Summer doldrums *should* help out but will see…
VX30 long/short without SPX Overlay down ~6% YTD, w/SPX Overlay ~1.5%, LOTS of whipsaws starting from mid Feb…


